Building & Debugging Zephyr Projects
Build, flash, and debug commands are available from the Active Project Panel, the status bar, and the command palette.
Building
Section titled “Building”
Sysbuild Targets
Section titled “Sysbuild Targets”If your build uses sysbuild, Flash, Debug, and Debug Attach may need to target a specific image/domain rather than the workspace default.
Use Zephyr IDE: Set Active Sysbuild Image to choose which sub-image the active build should use. IDE for Zephyr forwards that selection to west flash --domain <image> and uses it when resolving runners.yaml for debug.
Setting Up Debug Configuration
Section titled “Setting Up Debug Configuration”The IDE for Zephyr ships with two built-in debugger types:
zephyr-ide-cortexreadsrunners.yamlfrom the active build and translates it into acortex-debug/bmp-debugsession automatically.zephyr-ide-weststartswest debugserverand attaches cortex-debug as an external GDB client.
With these providers in place, the Debug, Build and Debug, and Debug Attach buttons work out of the box on a freshly-created build — no launch.json entries are required.
If you do create a launch.json, the simplest possible configuration is:
{ "name": "Zephyr IDE Cortex: Debug", "type": "zephyr-ide-cortex", "request": "launch"}The provider picks the runner from runners.yaml (preferring debug-runner), looks up the ELF and GDB paths recorded there, sets "rtos": "Zephyr", and passes the result to cortex-debug. To pin a specific cortex-debug server explicitly, add a "servertype" field ("jlink", "openocd", "pyocd", "stlink", "bmp", "qemu"); Zephyr IDE maps it back to the matching runner. A "runner" field is still accepted (mainly for bridged targets).
The zephyr-ide-cortex debugger ships snippets for the most common servers: J-Link, pyOCD, ST-Link, Black Magic Probe (launch and attach), a sysbuild-image variant, and an explicit-probe OpenOCD override — each using servertype. A “Debug (ask build at launch)” snippet uses the ask field to prompt for a build configuration each time F5 is pressed — set ask: "askBoth" to prompt for project as well. One “Cortex Debug (Legacy): Manual debug configuration” snippet is also provided for advanced cases where you need full control over GDB server arguments; its label begins with Cortex Debug (Legacy) so it is easy to distinguish. Bridge-based snippets (nrfjprog, LinkServer, STM32CubeProgrammer, OpenOCD-over-west, external GDB server) live under the Zephyr IDE West debugger.
Runners via West Debugserver Bridge
Section titled “Runners via West Debugserver Bridge”Some Zephyr runners have no native cortex-debug servertype. For these runners Zephyr IDE automatically spawns west debugserver --runner <runner> in the background, reads the GDB port it announces on stdout, and connects cortex-debug as servertype: "external" pointing at that port. If the port announcement is not detected within 10 seconds, Zephyr IDE falls back to the runner’s known default port and emits a warning.
Bridged runners:
| Runner | Default port | Notes |
|---|---|---|
nrfjprog | 2331 | Uses JLinkGDBServerCL under the hood |
linkserver | 3333 | NXP LinkServer GDB |
esp32 | 3333 | ESP32 OpenOCD |
stm32cubeprogrammer | 61234 | STM32_Programmer_CLI gdbserver |
To connect to an already-running GDB server instead of having Zephyr IDE spawn one, add "gdbTarget": "host:port" to your zephyr-ide-west launch configuration. This suppresses the bridge auto-spawn and passes the address directly to cortex-debug. See the “Zephyr IDE West: Attach to external GDB server” snippet in the Add Configuration picker for an example.
zephyr-ide-west also exposes curated west debugserver flags. Each field name mirrors its west debugserver flag (e.g. port → --port, gdbPort → --gdb-port, plus device, speed, config), and its description is tagged with the runner(s) it applies to ([Common], [openocd], [probe-rs, jlink], [jlink]).
Use westArgs to pass through any additional runner-specific flags that are not modeled explicitly.
Runner Profiles (Flash + Debug)
Section titled “Runner Profiles (Flash + Debug)”Each build can optionally reference one active Runner Profile that bundles three bind slots: Flash (drives both Flash and Build and Flash), Debug (drives both Debug and Build and Debug), and Debug Attach. Each slot is one of:
| Kind | Meaning |
|---|---|
auto | Use runners.yaml defaults — flash-runner for Flash, debug-runner for Debug and Attach. |
runner | A Zephyr runner directly (openocd, jlink, pyocd, blackmagicprobe, …) with optional extraArgs. |
launch | A launch.json configuration by name. Available for the Debug and Attach slots only; ignored for Flash because flash actions never start a debug session. |
When no profile is active on a build, all three slots fall back to auto. This is the default for newly-created builds — Flash / Debug / Build and Debug / Debug Attach just work using whatever Zephyr recorded in runners.yaml.
Profiles can be defined once (e.g. a Black Magic Probe wired to /dev/ttyACM0, or an OpenOCD ST-Link configuration) and shared across builds. The dedicated Zephyr IDE: Open Runner Profile Panel command gives you a full CRUD UI for both workspace-scope (.vscode/zephyr-ide.json#runnerProfiles) and user-scope (zephyr-ide.runnerProfiles setting) profiles.
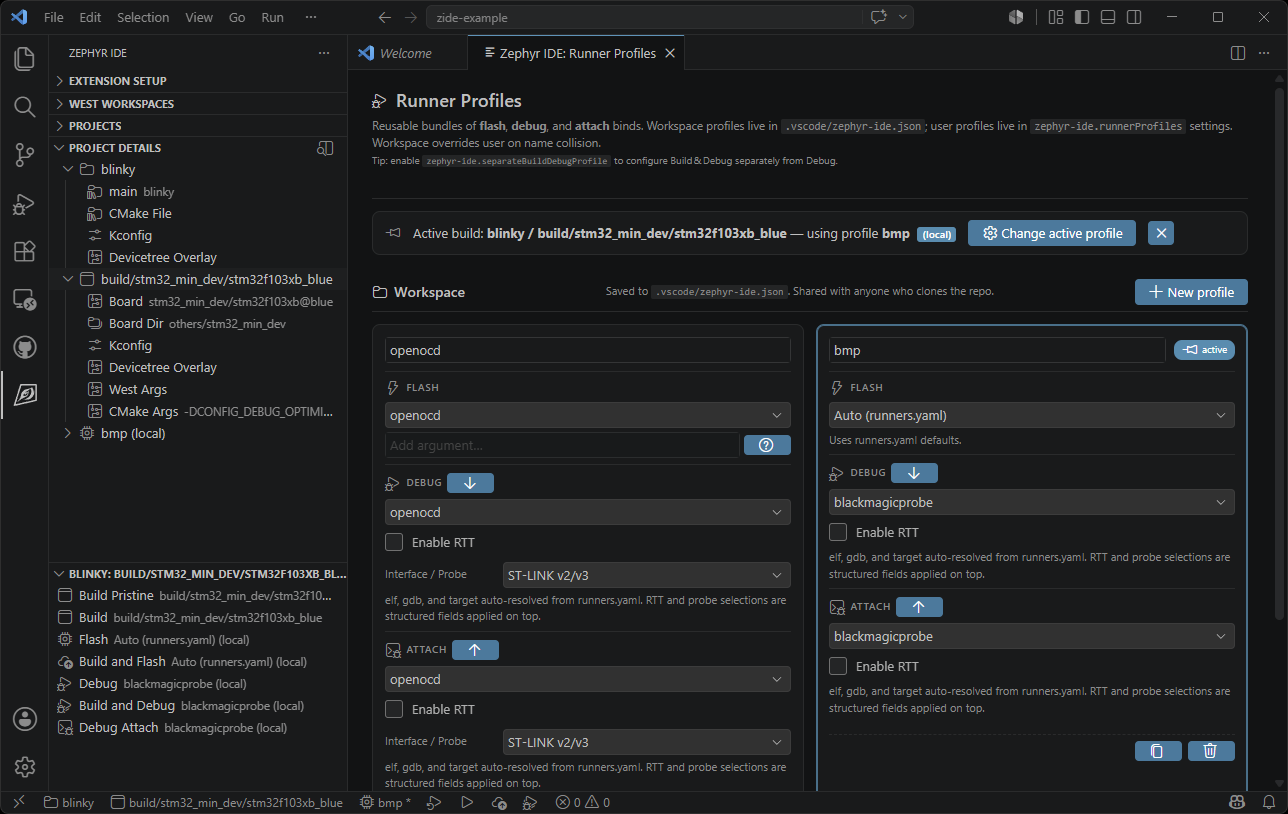
The Profile… button in the Project Build panel opens a QuickPick to select the active profile for the build. Per-build extra-argument overrides can be added with the pencil icon next to any runner-kind slot in the Project Build panel.
Local Overrides (Per-developer)
Section titled “Local Overrides (Per-developer)”When a project is shared with a team, the committed activeProfile in .vscode/zephyr-ide.json acts as the workspace default. Individual developers often need a different probe or runner without touching the committed file — for example, one developer uses J-Link while another uses OpenOCD.
Zephyr IDE supports this with a two-level local override system stored entirely in VS Code workspace state (never written to any file on disk):
1. Select a profile locally — Click Profile… in the Project Build panel (or run Zephyr IDE: Select Active Runner Profile) to choose a named profile as a local override. The committed .vscode/zephyr-ide.json is never modified. The status bar shows a * suffix (e.g. $(chip) openocd *) and tree views show (local) next to the profile name.
2. Override individual slots — Click Local Bind… next to a slot in the Project Build panel (or run Zephyr IDE: Set Local Slot Runner Bind) to pick a runner for that slot directly, without switching profiles. An amber (local) badge and a clear button (✕) appear on the slot row. Slot-level local binds take priority over the active profile’s slot bind.
3. Share your configuration — When you’re happy with your local setup, open the Runner Profile Panel (Manage… button) and choose:
- Update profile with local changes — saves your local slot runners back into the named profile.
- Create new profile from local changes — creates a new named profile from your current local configuration and binds it to the build.
The local overrides are preserved across VS Code restarts but never written to any file on disk — they live in VS Code’s per-workspace workspaceState.
See Runner Profiles in the Configuration reference for the full data model, scope and merge behaviour, per-build overrides, and legacy migration notes.
Runner Args Variable Substitution
Section titled “Runner Args Variable Substitution”The extraArgs of any runner-kind bind slot (and per-build overrides) support VS Code–style ${...} expressions resolved at flash/debug time. Unknown expressions are left intact for VS Code’s own resolver.
| Expression | Resolves to |
|---|---|
${workspaceFolder} | Workspace root path |
${buildFolder} | Build output directory |
${board} | Board name (e.g. nucleo_f401re) |
${boardRevision} | Board revision, or "" when not set |
${project} | Project name |
${build} | Build configuration name |
${buildvar:key} | Per-build custom variable (BuildConfig.customVars) |
${projectvar:key} | Per-project custom variable (ProjectConfig.customVars) |
${cmake:VAR} | Value from CMakeCache.txt (case-insensitive; e.g. ${cmake:CMAKE_GDB}) |
${kconfig:VAR} | Kconfig value from zephyr/.config (with or without CONFIG_ prefix; strings unquoted; unset symbols → "n") |
${env:VAR} | Environment variable, or "" when unset |
${config:some.key} | VS Code workspace/user configuration value |
| anything else | Left unchanged (VS Code resolves later) |
Custom build and project variables are managed with Zephyr IDE: Manage Build Variables and Zephyr IDE: Manage Project Variables, and can also be used in tasks.json/launch.json via the zephyr-ide.get-active-build-variable and zephyr-ide.get-active-project-variable input commands. See Custom Variables.
Example — Black Magic Probe serial port from a per-build variable:
--gdb-serial=${buildvar:bmp_port}Example — J-Link device name from CMakeCache.txt:
--device=${cmake:JLINK_DEVICE} --speed=${cmake:JLINK_SPEED}Example — board USB serial from Kconfig:
--gdb-serial=${kconfig:BOARD_BMP_GDB_PORT}Debug Prerequisites: Cortex-Debug
Section titled “Debug Prerequisites: Cortex-Debug”The zephyr-ide-cortex and zephyr-ide-west debugger types delegate the actual debug session to marus25.cortex-debug. The first time you try to Debug:
- If cortex-debug is not installed, the session is aborted and a notification appears with Open VS Code Marketplace and Open Open VSX buttons that link directly to its install page on each registry.
- If the resolved runner is Black Magic Probe (
bmp), the IDE also shows a one-time recommendation to installmylonics.bmp-debugfor Zephyr RTOS thread awareness. The recommendation only fires once and is silently skipped ifbmp-debugis already installed.
Launch Configuration Helper Commands
Section titled “Launch Configuration Helper Commands”The IDE provides commands that help a user develop launch configurations. These include the following:
zephyr-ide.get-active-project-namezephyr-ide.get-active-project-pathzephyr-ide.get-active-build-pathzephyr-ide.get-active-build-board-pathzephyr-ide.select-active-build-pathzephyr-ide.get-gdb-pathzephyr-ide.get-arm-gdb-pathzephyr-ide.get-toolchain-pathzephyr-ide.get-zephyr-dirzephyr-ide.get-zephyr-elfzephyr-ide.get-zephyr-elf-dirzephyr-ide.get-zephyr-ide-json-variablezephyr-ide.get-active-project-variablezephyr-ide.get-active-build-variablezephyr-ide.get-active-board-name
The ask field on zephyr-ide-cortex / zephyr-ide-west configurations controls build selection at launch. Set ask: "askBuild" to prompt for a build configuration each time the session starts, or ask: "askBoth" to prompt for project and build. The default (ask: "auto") silently uses the active project and build shown in the taskbar and Active Project panel. Alternatively, the zephyr-ide.select-active-build-path input command can be used in a cortex-debug configuration’s executable field to get the same build-picker behaviour.