What's New in 4.0
The 4.0 series of IDE for Zephyr introduces two major workflow improvements — Runner Profiles and the Build Dashboard — alongside all of the UI and workspace improvements that shipped in 3.0.
Runner Profiles and Easier Debug Support
Section titled “Runner Profiles and Easier Debug Support”Why this change?
Section titled “Why this change?”Before 4.0, flash and debug configuration lived inside individual builds as “runner variants” — one-off entries that were easy to create but hard to reuse across projects. If you used the same Black Magic Probe setup for ten different builds, you had to duplicate those runner settings ten times. Renaming a runner or changing a serial port meant hunting down every build that referenced it.
Runner Profiles replace that model. A Runner Profile is a named, reusable { flash, debug, attach } triplet. Define it once — at workspace scope (.vscode/zephyr-ide.json) or user scope (zephyr-ide.runnerProfiles VS Code setting) — and assign it to as many builds as you like. Changing the profile updates every build that uses it.
What changed
Section titled “What changed”- Profiles are named and reusable. Create a profile for your J-Link, another for your OpenOCD ST-Link, a third for your Black Magic Probe, and switch between them per-build with a single click.
- Three slots per profile: Flash, Debug, Attach. Each slot independently chooses between
auto(userunners.yamldefaults),runner(name a specific Zephyr runner with optionalextraArgs), orlaunch(reference alaunch.jsonconfig by name — Debug and Attach only). - Variable substitution in runner args.
extraArgssupports${workspaceFolder},${buildFolder},${board},${cmake:VAR},${kconfig:VAR},${env:VAR}, and custom build/project variables, so a profile can be truly portable across boards and environments. - Dedicated Runner Profile panel. The
Zephyr IDE: Open Runner Profile Panelcommand opens a full CRUD UI listing workspace-scope and user-scope profiles side by side, with a usage badge on each card showing how many builds reference it. - No
launch.jsonrequired. The built-in debug providers (zephyr-ide-cortexfor cortex-debug/bmp-debug andzephyr-ide-westfor west debugserver) readrunners.yamlfrom the active build and start debug sessions automatically. A Runner Profile is optional — builds without one continue to userunners.yamldefaults.
West debugserver options expanded
Section titled “West debugserver options expanded”The zephyr-ide-west provider now exposes a broader curated option surface for common west debugserver flags, including context/domain selection, file overrides, explicit port controls, and skip/reset/load toggles.
- Curated fields now include options such as
domain,file,elfFile,hexFile,binFile,gdbPort,tclPort,telnetPort,noLoad,noReset,rebuild, andnoRebuild. - Other curated fields include
devId,toolOpt, andport. - Every curated field name mirrors its
west debugserverflag (e.g.port→--port,gdbPort→--gdb-port), and its description is tagged with the runner(s) it applies to:serial,interface,frequency,connectUnderReset,erase,noErase,reset,rttAddress,tui,config,flashAddress,verify,verifyOnly,noHalt,noInit,noTargets,targetHandle,rttPort,rttServer,gdbHost,gdbClientPort,gdbInit,chip,protocol,speed,batch,device,loader,dtFlash, andresetType. westArgsis still preserved as a raw passthrough array so any unsupported or future runner-specific flags can be supplied without waiting for schema updates.
Note on test coverage: Not all debug runner paths and hardware combinations have been exercised. As a general rule — if you can start a debug session using a hand-written Cortex-Debug
launch.json, thezephyr-ide-cortexorzephyr-ide-westdebug type should work for that same setup. If a runner path that should work gives you trouble, you can always create a manual Cortex-Debug launch configuration in yourlaunch.jsonas a fallback. Please raise an issue on GitHub so it can be tracked and fixed.
Build Dashboard
Section titled “Build Dashboard”Why this change?
Section titled “Why this change?”With complex projects it was difficult to get a quick overview of what a build produced. Build logs, memory reports, and Kconfig settings were scattered across different tools and files. The Build Dashboard brings them into one place without leaving VS Code.
What’s in the dashboard
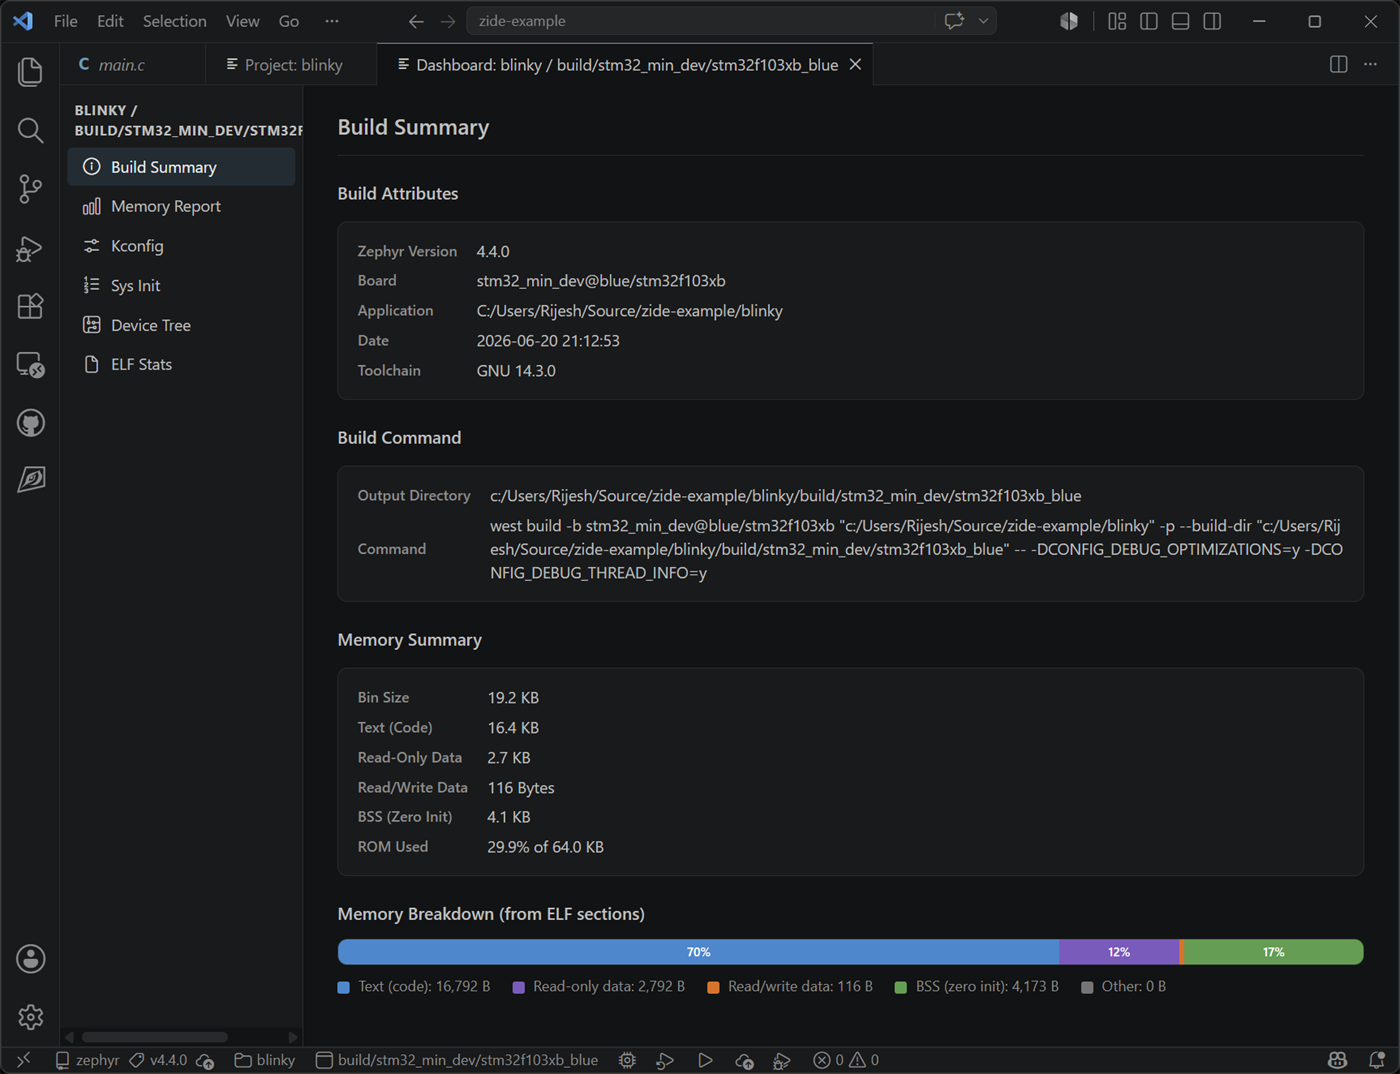
Section titled “What’s in the dashboard”The Build Dashboard opens via Zephyr IDE: Open Build Dashboard after a successful build and shows three pages:
Summary — key build facts at a glance: board, build folder, build time, active Kconfig fragments, and a one-click rebuild control.
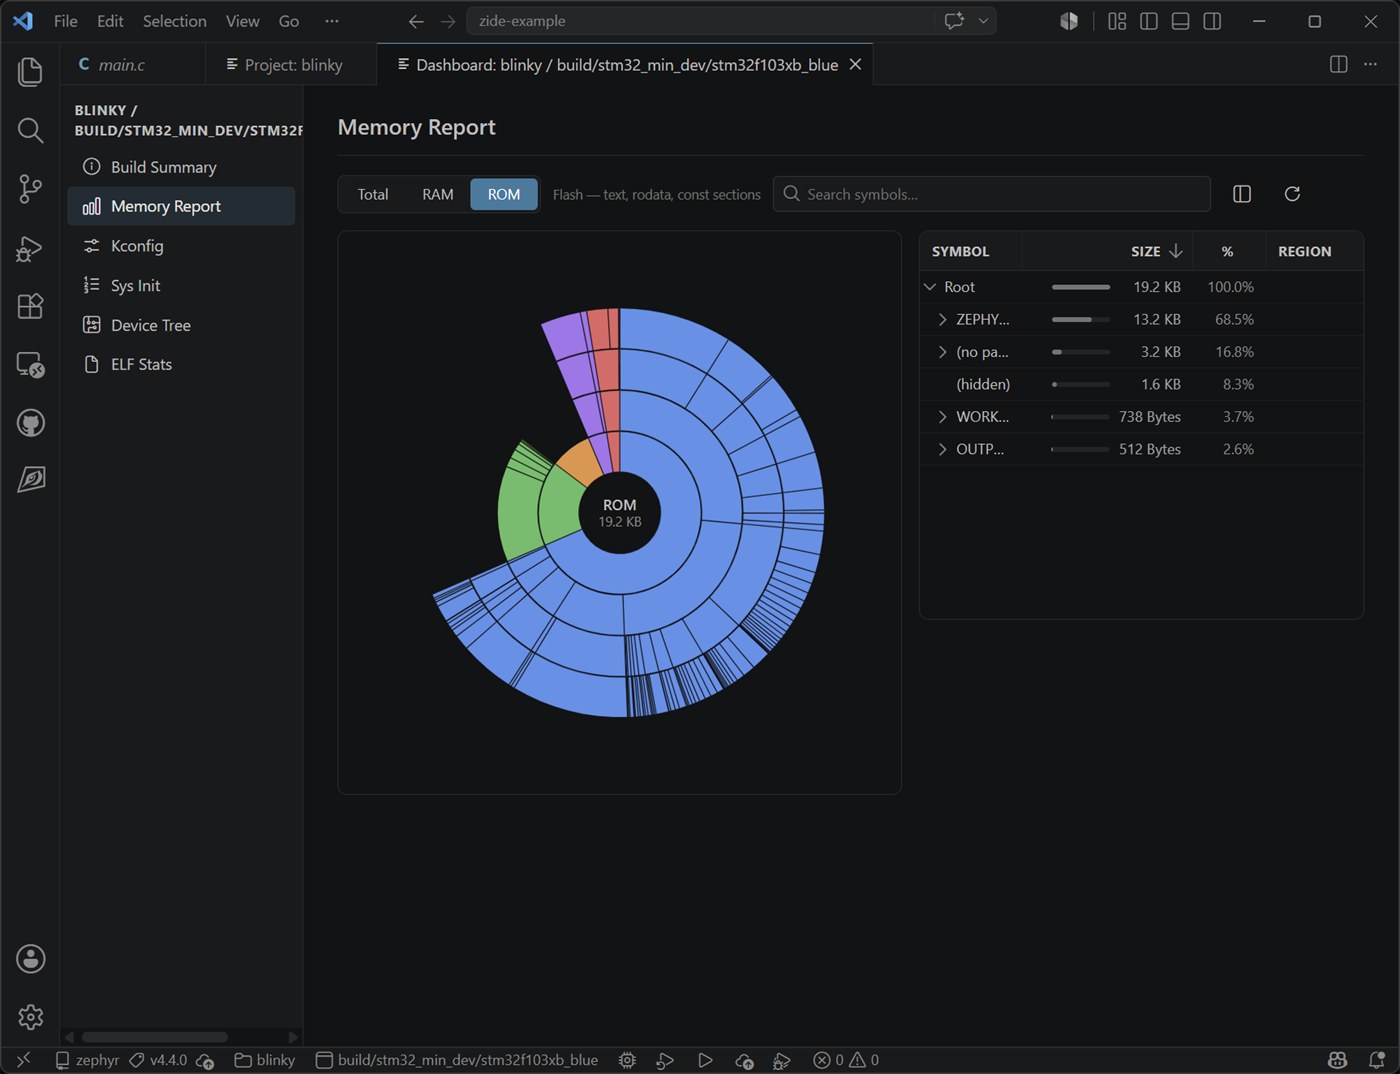
Memory report — per-region RAM and ROM usage pulled live from the build, with a refresh button to update after a rebuild.
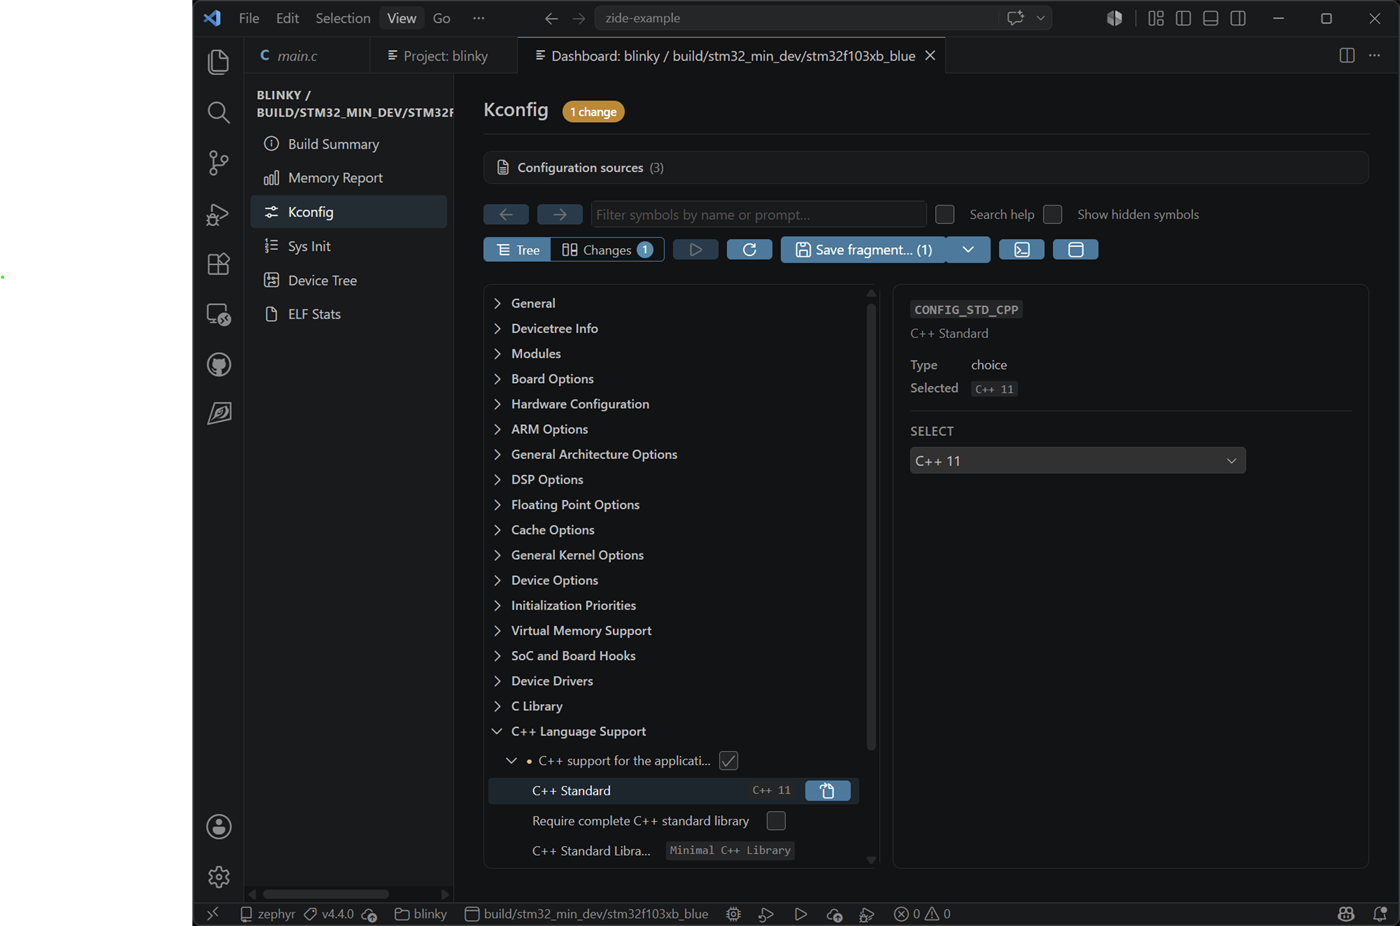
Kconfig editor — browse the full resolved Kconfig tree for the build, edit symbol values, and save changes as a Kconfig fragment that automatically attaches to the build or project.
Everything from 3.0
Section titled “Everything from 3.0”4.0 is a superset of 3.0. All of the following shipped in the 3.x series and remain in 4.0.
Refreshed project and settings panels
Section titled “Refreshed project and settings panels”The project build view and the settings panel have been rebuilt on top of vscode-elements v2 web components and a shared design system aligned with VS Code walkthroughs.
- A new project & build settings page with inline editing for west args, CMake args, KConfig overlays, and devicetree overlays.
- Per-build args are stored as string arrays (with automatic migration from legacy strings) so they round-trip cleanly through git and can be edited one entry at a time.
- Project-level and build-level custom variables can be added, renamed, and edited inline, with configurable defaults via the
zephyr-ide.projectVariableDefaultsandzephyr-ide.buildVariableDefaultssettings.
Improved workspace handling
Section titled “Improved workspace handling”- Multiple west workspaces — register several west workspaces and switch between them from the workspace panel without reopening VS Code.
- Native VS Code tree view for the project explorer, replacing the previous webview tree for better integration with VS Code’s keyboard, drag-and-drop, and theming.
- Multi-root debug — debug launches now resolve the correct workspace folder when working in
.code-workspacesetups. - Workspace progress page that surfaces what the extension is doing during long-running setup and update operations.
General UI performance
Section titled “General UI performance”- A unified webview design language with shared CSS primitives across every panel — fewer custom styles, faster load, and a consistent look.
- Webview initialization race conditions on startup have been eliminated.
- The setup panel now uses a card-based interaction model that is consistent across host tools, SDK, and workspace flows.
Other notable changes (3.x)
Section titled “Other notable changes (3.x)”- Setting keys have moved to camelCase (
zephyr-ide.toolchainDirectory,zephyr-ide.useGuiConfig,zephyr-ide.venvFolder, …) with automatic migration from the older snake_case / kebab-case names. - Launch configuration helpers gained
zephyr-ide.get-zephyr-elf,zephyr-ide.get-zephyr-elf-dir,zephyr-ide.get-arm-gdb-path, andzephyr-ide.get-active-board-name. - The extension was renamed from Zephyr IDE to IDE for Zephyr. The marketplace identifier (
mylonics.zephyr-ide) and allzephyr-ide.*commands and settings remain unchanged.
For the full per-PR list of changes, see the CHANGELOG.
Upgrading from v3.x
Section titled “Upgrading from v3.x”4.0 is a clean in-place upgrade from any 3.x release. Existing workspaces, projects, and settings continue to work. A few things to be aware of:
- Runner Profiles replace per-build runner variants. Existing variant-style runner settings are automatically migrated to named profiles on first activation. No action is required, but you can review and rename the migrated profiles in the Runner Profile panel.
.vscode/zephyr-ide.jsongains arunnerProfilessection. If you commit this file to version control, add the new section to your next commit so collaborators pick up the shared profiles.
Upgrading from v2.4
Section titled “Upgrading from v2.4”If you are upgrading all the way from v2.4, also note:
.vscode/zephyr-ide.jsonis rewritten on first open. The extension migrates the file automatically on first activation. If you may need to roll back, commit or back up.vscode/zephyr-ide.jsonbefore upgrading.- “Global Install” no longer appears as a special entry. Any workspace previously registered as the global install is now shown as a normal entry in the multi-workspace list. No action is needed.
- Windows users should re-run Host Tools after upgrading. 7-Zip is now installed via
wingetthrough the Host Tools panel rather than bundled with the extension. - The first build of each project after upgrading may be a full (pristine) rebuild. Cache-invalidation logic detects when CMake-affecting inputs have changed and forces
--pristinewhen needed. On first launch the cache is empty, so each project rebuilds once, then incremental builds resume as normal.